The Gold-to-Bitcoin Ratio: Reading Two Stores of Value
The gold-to-bitcoin ratio shows how many ounces of gold one Bitcoin buys. See how to calculate it, its history since 2014 and which price really moves it.
· 11 min read
The gold-to-bitcoin ratio is the number of troy ounces of gold that one Bitcoin buys: Bitcoin's dollar price divided by gold's dollar price per ounce. On 5 November 2026 it was about 19.4 ounces (Bitcoin $80,420, gold about $4,141, CoinGecko). A rising ratio means Bitcoin is gaining on gold, and a falling one means gold is gaining on Bitcoin. This guide shows how to calculate it, how it has moved since 2014, and the check most charts skip: which of the two prices actually moved.
Key takeaways
- Ratio = Bitcoin price ÷ gold price per troy ounce, quoted as ounces of gold per Bitcoin (BTC/XAU). Flipped, it is Bitcoin per ounce of gold (XAU/BTC), about 0.0515 BTC on 5 November 2026.
- The highest monthly average so far was 37.1 ounces in December 2024, ten months before Bitcoin's dollar record in October 2025.
- Bitcoin drives most of it: about 96% of the ratio's month-to-month variation since 2014. Over the last 24 months gold's share rose to about 17%.
- In 11 of the last 153 months Bitcoin rose and the ratio still fell, and five of those have come since September 2024. A falling ratio is not the same as a falling Bitcoin.
- It measures relative strength. It does not say whether either asset is cheap or expensive in dollars.
How do you calculate the gold-to-bitcoin ratio?
Divide the Bitcoin price by the gold price, both in US dollars and taken at the same time. The result is the number of troy ounces of gold that one Bitcoin buys.
- Take the Bitcoin spot price in USD.
- Take the gold price per troy ounce in USD (XAU/USD).
- Divide Bitcoin by gold.
With the 5 November 2026 figures, $80,420 ÷ $4,141 = 19.42. The same relationship can be written three ways:
| Quote | Formula | 5 Nov 2026 | Reads as |
|---|---|---|---|
| BTC/XAU, the usual one | Bitcoin ÷ gold | 19.42 | Ounces of gold per Bitcoin |
| XAU/BTC, the reverse | Gold ÷ Bitcoin | 0.0515 | Bitcoin per ounce of gold |
| Grams per Bitcoin | BTC/XAU × 31.1035 | About 604 g | Grams of gold per Bitcoin (one troy ounce is 31.1035 g) |
Check which way round a chart is before reading it. A rising BTC/XAU means Bitcoin is winning; a rising XAU/BTC means gold is winning. TradingView lists both, as BTCXAU and XAUBTC, and Metalcharts has a BTC/XAU chart.
How the sum behaves (a scenario, not a forecast): from $80,420 and $4,141, if Bitcoin rises 10% and gold stays flat, the ratio goes from 19.42 to 21.36. If gold then rises 10% too, it falls back to 19.42. The ratio only records the difference between the two returns.
Our gold vs Bitcoin tool shows the live ratio with its 20-day and 90-day change and a 200-day chart. It uses gold futures and Binance closes, so it read 19.63 on the same morning. Small gaps between providers are normal.
What has the ratio looked like over time?
The ratio rose from under one ounce in 2015 to a record monthly average of 37.1 ounces in December 2024, and it lost 63% to 77% in each of the last three bear markets. It stood at 20.0 ounces on average in October 2026.
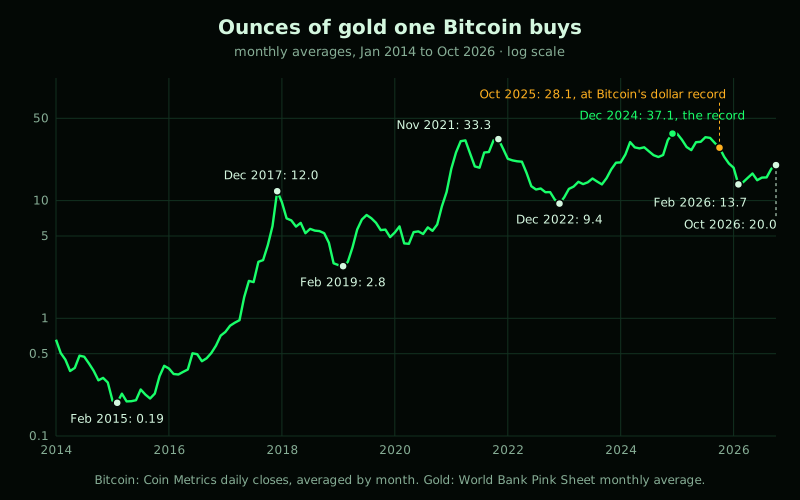
| Month | Bitcoin (average) | Gold (average) | Ounces per Bitcoin | What was happening |
|---|---|---|---|---|
| Feb 2015 | $235 | $1,227 | 0.19 | Lowest in this series, long after the 2013 peak |
| Dec 2017 | $15,194 | $1,264 | 12.02 | Retail-led Bitcoin peak |
| Feb 2019 | $3,659 | $1,320 | 2.77 | Bear-market low, gold rising |
| Nov 2021 | $60,685 | $1,822 | 33.31 | Bitcoin's peak that cycle |
| Dec 2022 | $16,937 | $1,798 | 9.42 | Crypto winter, gold steady |
| Dec 2024 | $98,247 | $2,648 | 37.10 | The record, with Bitcoin near $100,000 |
| Oct 2025 | $114,120 | $4,058 | 28.12 | Bitcoin's dollar record, after gold rose 53% in ten months |
| Feb 2026 | $68,855 | $5,020 | 13.72 | Bitcoin falling, gold at its highest monthly average |
| Oct 2026 | $82,129 | $4,105 | 20.01 | Latest full month |
These are monthly averages, so daily charts show higher highs and lower lows. Using daily figures, the ratio reached about 40 ounces in December 2024 (Bitcoin's $106,116 close on the 17th against that month's average gold price), and CoinGecko's daily series bottomed near 12.3 ounces on 2 March 2026.
In 2017 and 2021 the ratio topped in the same month as Bitcoin's dollar price. The latest cycle broke that habit. The ratio topped ten months before Bitcoin's record close of $124,824 on 6 October 2025, and bottomed four months before Bitcoin's lowest close so far, $58,525 on 30 June 2026 (both Coin Metrics, see our crypto market cycle guide). Gold's own moves caused the gap.
Which price actually moved the ratio?
Usually Bitcoin, but gold has started to matter. To split any move, compare the change in each price over the same dates: ratio change = (1 + Bitcoin change) ÷ (1 + gold change) − 1.
| Stretch (monthly averages) | Bitcoin | Gold | Ratio | What did it |
|---|---|---|---|---|
| Dec 2017 to Feb 2019 | −75.9% | +4.4% | −76.9% | Bitcoin |
| Feb 2019 to Nov 2021 | +1,558% | +38.0% | +1,101% | Bitcoin |
| Nov 2021 to Dec 2022 | −72.1% | −1.3% | −71.7% | Bitcoin |
| Dec 2022 to Dec 2024 | +480% | +47.3% | +294% | Bitcoin, with gold slowing it |
| Dec 2024 to Oct 2025 | +16.2% | +53.2% | −24.2% | Gold. Bitcoin rose and the ratio still fell |
| Oct 2025 to Feb 2026 | −39.7% | +23.7% | −51.2% | Both, pulling the same way |
| Feb 2026 to Oct 2026 | +19.3% | −18.2% | +45.9% | Both, pulling the other way |
We ran the same split on all 153 monthly changes from January 2014 to October 2026:
- Size of the moves. Bitcoin's monthly changes had a standard deviation of 17.1%, against 3.5% for gold.
- Share of the variation. Bitcoin explains about 96% of the ratio's monthly variation and gold about 4%. Over the last 24 months the split is about 83% and 17%.
- Direction. The ratio moved the same way as Bitcoin in 140 of 153 months (92%). In 11 months Bitcoin rose while the ratio fell, and five of those have come since September 2024. In two months (November 2019 and October 2022) Bitcoin fell while the ratio rose.
So for most of its history the ratio has been close to a Bitcoin chart in different units. Since late 2024 it has also been a gold chart, which is why you should look at both prices before reading anything into it.
Why do people compare Bitcoin with gold?
People compare them because Bitcoin has a fixed supply cap of 21 million coins, which gives it a scarcity story similar to gold's, and because both can be held outside the banking system. Supporters call Bitcoin "digital gold". Critics point to its much larger swings.
| Feature | Gold | Bitcoin |
|---|---|---|
| Supply | Grows slowly as mining adds to the above-ground stock | Capped at 21 million, issuance halves about every four years |
| Track record | Thousands of years | Since 2009 |
| Monthly moves since 2014 (standard deviation) | 3.5% | 17.1% |
| Monthly moves, last 12 months | 5.7% | 12.9% |
| Typical behaviour in a panic | Often holds or rises | Has often fallen with risk assets |
| Custody | Vault, bank or physical | Self-custody or exchange |
| Cash flow | None | None |
Bitcoin's moves have been about five times gold's since 2014, and a little over twice gold's in the last 12 months, partly because gold itself became unusually volatile. That table is why "digital gold" is a claim and not a fact. For the full side-by-side and how gold fits our macro chain, read our gold vs Bitcoin guide.
What does a rising or falling ratio mean?
A rising ratio means Bitcoin is outperforming gold, which usually happens when liquidity is abundant and risk appetite is high. A falling ratio means gold is outperforming, often when fear, inflation worries or falling crypto prices push capital towards the older asset.
| Ratio direction | Typical backdrop | Read as |
|---|---|---|
| Rising fast | Liquidity expanding, ETF inflows, rising risk appetite | Risk-on |
| Flat | Both assets moving together | Mixed signal |
| Falling, Bitcoin falling | Bitcoin bear market | Risk-off |
| Falling, Bitcoin rising | Gold rallying faster, as in 2025 | Gold bid, not a Bitcoin problem by itself |
Do not read it as a buy or sell signal for Bitcoin. In the ten months to October 2025 the ratio fell 24.2% while Bitcoin rose 16.2%. From February to October 2026 it rose 45.9%, and more than half of that came from gold falling.
Is Bitcoin a safe haven like gold?
Not on the record so far. A safe haven holds or gains value when markets fall. On monthly averages, gold did that in these three episodes and Bitcoin did not:
| Episode (monthly averages) | Bitcoin | Gold |
|---|---|---|
| Covid crash, Feb to Mar 2020 | −28.6% | −0.3% |
| 2022 bear market, Dec 2021 to Dec 2022 | −65.7% | +0.4% |
| Latest fall, Oct 2025 to Feb 2026 | −39.7% | +23.7% |
Gold is not a guarantee either. It fell 18.2% from February to October 2026, while Bitcoin rose 19.3%.
Which assets are called safe havens?
| Safe haven asset | Why people use it | Limits |
|---|---|---|
| Gold | Long history, central-bank holdings | No yield, storage cost |
| US Treasury bonds | Backed by the US government | Fall when rates rise |
| US dollar | Global reserve currency | Loses value to inflation |
| Swiss franc, Japanese yen | Historic flight-to-safety currencies | Policy shifts can break the pattern |
| Bitcoin | Fixed supply, outside the banking system | Has behaved like a risk asset in sell-offs |
Bitcoin may grow into a store of value if its swings shrink and holders take a longer view, but that is an argument, not a result.
How can you use the ratio in practice?
Use it for context and to compare relative performance, never for exact timing.
- Check the direction over a quarter and a year, not a day.
- Split the move. Is the ratio moving because of Bitcoin, gold or both? The formula above takes a minute.
- Match it with the dollar and real yields, which move both assets. Our dollar index tool shows the dollar side.
- Compare it with the cycle phase. In a bear phase, a low ratio is normal.
- Check what is happening inside crypto, such as Bitcoin dominance. The ratio says nothing about altcoins.
- Do not set targets from past highs. The ratio has no fixed ceiling or floor.
The ratio is a side dial. The way we score market seasons, including Gold Season, is on our methodology page.
Data and method
- Bitcoin history: Coin Metrics daily reference-rate closes, averaged by calendar month.
- Gold history: World Bank Commodity Markets "Pink Sheet" monthly average price, read from the public DataHub gold-prices file, latest month October 2026.
- Ratio: Bitcoin's monthly average divided by gold's, January 2014 to October 2026, 154 months and 153 monthly changes.
- Variation shares: the covariance of each price's monthly log change with the ratio's, divided by the variance of the ratio's. The two shares add up to 100%.
- Today's figure and the daily low: CoinGecko, read at 05:03 UTC on 5 November 2026. The gold price is what CoinGecko's Bitcoin-in-gold rate implies.
We used monthly averages because we could check gold back to 2014 on a monthly basis from one published source. Averages hide daily extremes, and other providers' figures vary slightly. Gold prices here are not the same series as our live tool, which uses gold futures.
FAQ
What is the gold-to-bitcoin ratio?
It is the number of troy ounces of gold that one Bitcoin buys: Bitcoin's USD price divided by gold's USD price per ounce. It was about 19.4 ounces on 5 November 2026 (CoinGecko). A higher number means Bitcoin has outperformed gold, and a lower one means gold has outperformed Bitcoin.
What is the highest the ratio has been?
The highest monthly average was 37.1 ounces in December 2024, using Coin Metrics and World Bank data. On daily figures it reached about 40 ounces that month. It was already down to 28.1 by October 2025, when Bitcoin set its dollar record, because gold had risen faster.
Is Bitcoin digital gold?
It is called digital gold because of its capped supply and its use as a store of value outside banks. But its monthly moves have been about five times gold's since 2014, and it fell sharply in 2020 and 2022 while gold held. It is a developing store of value, not a proven one.
What are safe haven assets?
Safe haven assets are expected to hold or gain value when markets fall. Common examples are gold, US Treasury bonds, the US dollar, the Swiss franc and the Japanese yen. Bitcoin is sometimes added to the list, but it has not reliably behaved that way so far.
Where can I see the gold-to-bitcoin ratio chart?
TradingView shows it as BTCXAU and Metalcharts has a BTC/XAU chart. Our gold vs Bitcoin tool shows the live ratio, its 20-day and 90-day change and a 200-day chart, alongside both prices and their correlation.
Does a high ratio mean Bitcoin is overvalued?
Not by itself. A high ratio says Bitcoin has outperformed gold, which happens in bull markets. It does not say whether Bitcoin is expensive in dollar terms, and a low ratio does not make it cheap. Pair it with valuation measures and cycle context before drawing any conclusion.
Figures dated in the text, from Coin Metrics, the World Bank and CoinGecko. Educational content, not financial advice.