Crypto Winter: How to Recognise One and What Ends It
A crypto winter is a long, deep crypto bear market. Learn the seven signs that mark one, how the 2014, 2018 and 2022 winters ended, and where things stand now.
· 12 min read
A crypto winter is a long, deep bear market in which prices fall far below their highs, money and leverage leave the market, and interest dries up for months rather than weeks. The clearest test is time plus depth: Bitcoin closing below its 200-day moving average for a month or more while sitting 50% or more below its all-time high. By that test the market is not in a crypto winter as of 13 October 2026: Bitcoin was about $83,100, roughly 34% below its $126,080 record of 6 October 2025 (CoinGecko), and it has closed above its 200-day average every day since 19 August 2026 (Binance daily closes). This guide gives you a seven-sign scorecard to check for yourself, shows how past winters ended, and scores 2022, the 2026 low and today side by side.
Key takeaways
- A crypto winter is a bear market that is deep, long and structural. The three past winters kept Bitcoin below its 200-day average for 321 to 385 days and took it down 77% to 84% on closing prices (CoinGecko Research).
- No single chart defines one. Score seven signs: trend, depth, valuation, stablecoin liquidity, leverage, sentiment and damage. Five or more fully on means winter.
- Winters have ended when forced sellers ran out, leverage was flushed, stablecoin supply started growing again and price reclaimed its long-term averages. A headline rarely marks the bottom.
- The 2025–26 decline was a real bear market: about 53% on closing prices at its worst, on 30 June 2026. It turned three signs fully on and three partly on, which put it at the edge of a winter but not in one.
- The scorecard describes conditions. It is not a timing signal, and it is not advice.
What is a crypto winter?
A crypto winter is an extended period of falling or flat crypto prices, low trading activity and shrinking investment, usually following the blow-off top of a bull market. The phrase became common during the long slump of 2018. It describes more than price: in a winter, companies cut staff, projects stop shipping, lenders and exchanges fail, and retail attention disappears.
Three words get used loosely, so it helps to separate them:
| Term | Typical Bitcoin fall from the high | Typical length | What else is happening |
|---|---|---|---|
| Correction | 10% to 30% | Days to weeks | Leverage shaken out, trend intact |
| Bear market | 30% to 60% | Months | Below the long-term trend, sentiment poor |
| Crypto winter | 70% or more for Bitcoin, 90%+ for many altcoins | Most of a year or longer | Liquidity leaving, failures, layoffs, interest gone |
These bands are our rules of thumb, drawn from the cycles below. They are not official definitions.
How long does a crypto winter last?
Past crypto winters kept Bitcoin below its 200-day average for about 11 to 13 months, and each took roughly a year to get from the peak to the bottom. Getting back to the old high took longer still: two to three years or more after each peak. CoinGecko counts a bear market as any stretch where Bitcoin closes below its 200-day moving average for 30 or more days in a row (CoinGecko Research, data to 24 June 2026). On that method:
| Period | Days below the 200-day average | Max Bitcoin drawdown (closes) | Bottom (close) | What broke |
|---|---|---|---|---|
| 2014–15 winter | 321 | 81.6% | $172, 14 Jan 2015 | Mt. Gox, then the largest exchange, halted withdrawals and filed for bankruptcy in February 2014 |
| 2018 winter | 385 | 83.6% | $3,217, 15 Dec 2018 | The 2017 ICO bubble burst and most tokens never recovered |
| 2022 winter | 381 | 76.7%, from a $67,617 close | $15,742, Nov 2022 | Terra/LUNA (May), Celsius and Three Arrows Capital (June–July), FTX (November) |
| 2025–26 bear market | 289 (3 Nov 2025 to 18 Aug 2026) | About 53%, from a $124,659 close | $58,625, 30 Jun 2026 | About $19 billion of positions liquidated on 10–11 October 2025, days after the peak (CoinGlass) |
The first three rows are CoinGecko's figures. The 2025–26 row is our count on Binance BTCUSDT daily closes with a 200-day simple average, because CoinGecko's study stopped on 24 June 2026, before the final low; at that point it had recorded a 51.2% drawdown.
Two patterns stand out. Since 2018 each drawdown has been shallower than the one before: 83.6% in 2018, 76.7% in 2022 and about 53% in 2025–26, which fits a larger, more liquid market with more long-term holders. And the time spent below the trend has been steady at roughly ten months to a year. That consistency is one reason the bitcoin 4-year cycle is still discussed, even by people who doubt it.
How do you recognise a crypto winter? The seven signs
You recognise a crypto winter when most of these seven signs are on at the same time. Each one can be checked with free data in a few minutes.
| # | Sign | What to check | "Winter" reading | Free source |
|---|---|---|---|---|
| 1 | Trend | Bitcoin vs its 200-day moving average | Below it for 30+ days in a row | TradingView, CoinGecko |
| 2 | Depth | Bitcoin's fall from its all-time high | 50% or more (past winters: 77–84%) | CoinGecko |
| 3 | Valuation | Price vs realised price (the average cost of all coins) | At or below realised price; MVRV near or under 1 | Glassnode, LookIntoBitcoin |
| 4 | Liquidity | Total stablecoin supply | Falling for several months | DefiLlama stablecoins |
| 5 | Leverage | Open interest and funding rates | Open interest down sharply; funding flat or negative for weeks | CoinGlass, exchange funding history |
| 6 | Sentiment | Fear & Greed, search interest, volumes | "Extreme fear" for weeks; search and volume near multi-year lows | alternative.me, Google Trends |
| 7 | Damage | Failures and layoffs | A large lender, exchange or stablecoin fails; firms cut staff | News, court filings |
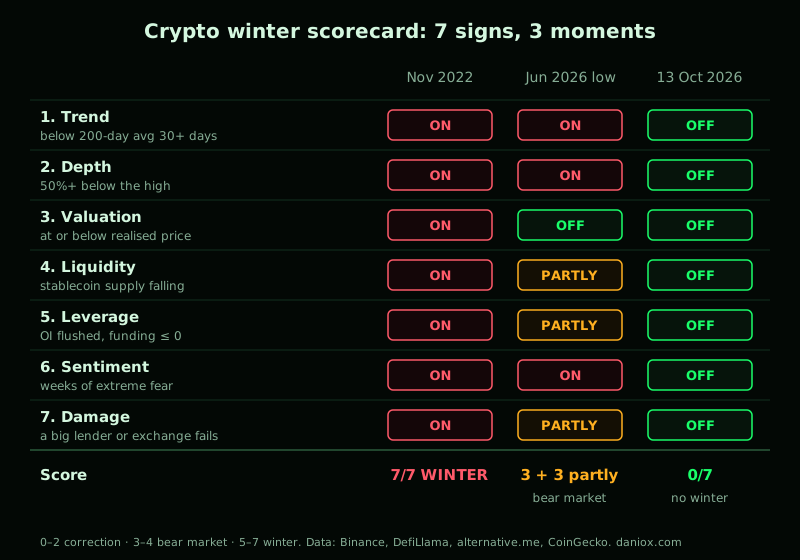
How to score it: count the signs that are fully on, and note the ones that are only partly on. 0–2 is a correction or a pause. 3–4 is a bear market. 5–7 is a crypto winter.
A few notes on reading the signs:
- Signs 1 and 2 are necessary, not sufficient. Price can halve in a crash and recover quickly. In March 2020 Bitcoin fell from a $7,935 close to an intraday low near $3,782 in two days, and it closed back above $7,935 within seven weeks (Binance BTCUSDT). Time below the trend is what separates a crash from a winter.
- Sign 4 is the one most people skip. Stablecoins are the cash inside crypto. When their total supply shrinks, money is leaving the system, not just rotating. In the 2022 winter, total stablecoin supply fell from about $187 billion in April 2022 to about $123 billion in August 2023, a drop of roughly a third (DefiLlama). Our guide to USDT dominance shows how to split a stablecoin move into "new money" and "everything else falling".
- Sign 6 lags. Sentiment reaches its worst after most of the price damage is done, which is why extreme fear has often lined up with the later stages of a winter rather than its start.
- Rotation is a clue, not a sign. In winters, Bitcoin dominance usually rises as altcoins fall harder. Check it on our live bitcoin dominance page, but don't count it on its own; it also rises in Bitcoin-led bull markets.
What usually ends a crypto winter?
Crypto winters have ended when the forced selling ran out and money started coming back in, not on a particular date or headline. In each past winter the same sequence showed up, in roughly this order:
- Capitulation. A final, violent leg down, either around a failure (FTX in November 2022) or as the end of a long grind (Bitcoin broke below $6,000 in November 2018 and bottomed near $3,200 in December). Weak holders and leveraged positions are cleared out.
- A long, boring base. Price moves sideways for months on low volume. Volatility falls. Most people stop paying attention.
- Liquidity turns. Stablecoin supply stops shrinking and starts growing, and wider dollar liquidity (central-bank policy, real yields, a softer US dollar) stops tightening.
- The trend is reclaimed. Bitcoin closes back above its 200-day average and holds it for a month, and later reclaims longer averages such as the 200-week.
- A new demand story. Each recovery had one: the July 2016 halving, institutional custody in 2019–20, and US spot Bitcoin ETFs, approved on 10 January 2024.
| Period | Bottom | What turned it |
|---|---|---|
| 2014–15 | January 2015 | A long base through 2015, then the run-up to the 2016 halving |
| 2018 | December 2018 | Capitulation from about $6,000 to the low $3,000s, then a sharp rally in spring 2019 |
| 2022 | November 2022 | FTX was the capitulation; 2023 brought falling inflation, a long base, then growing stablecoin supply and spot ETF demand |
| 2025–26 | 30 June 2026 (closing low) | Bitcoin closed back above its 200-day average on 19 August 2026, and stablecoin supply turned up again from mid-August |
The common thread is that the bottom is only visible afterwards. The signs that a winter is ending (supply growing, trend reclaimed) arrive after the low, so anyone waiting for confirmation pays more than the bottom price. That is the trade-off, and it's a reasonable one.
Worked example: scoring November 2022, the 2026 low and today
Here is the scorecard applied to three moments: the bottom of the 2022 winter, the closing low of the 2025–26 decline, and today.
| Sign | November 2022 | June 2026 low | 13 October 2026 |
|---|---|---|---|
| 1. Trend | On. Below the 200-day average for most of the year | On. Below it on every close since 3 Nov 2025 | Off. Above it since 19 Aug 2026; the 200-day average is about $72,200 |
| 2. Depth | On. −76.7% | On. About −53% | Off. About −34% |
| 3. Valuation | On. Price below realised price, MVRV under 1 | Off. The $58,625 low close stayed about 10% above a realised price near $53,000 (LookIntoBitcoin, July 2026) | Off. MVRV about 1.5 |
| 4. Liquidity | On. Stablecoin supply shrinking since April 2022 | Partly. Total supply slipped about 5% from its 17 May peak of $320.8bn to $303.7bn on 11 August, but stayed about 23% above June 2025 | Off. $311.1bn, up from $302.8bn a year earlier |
| 5. Leverage | On. Funding near zero (Nov–Dec 2022 average +0.0012% per 8 hours) after the FTX deleveraging | Partly. Funding was negative in 95 of 175 periods in Feb–Mar 2026, but averaged +0.0034% in June | Off. Funding averaged +0.0038% per 8 hours over the last 30 days |
| 6. Sentiment | On. "Extreme fear" on 16 days in November; June 2022 averaged 11 | On. "Extreme fear" for 35 days in a row, 2 June to 6 July 2026 | Off. Fear & Greed 57, "Greed" |
| 7. Damage | On. FTX, Celsius, Three Arrows Capital, Terra | Partly. Institutional lender BlockFills filed for Chapter 11 in March 2026 (Bankless); nothing on the scale of FTX | Off. No major failure |
| Score | 7 of 7: winter | 3 on, 3 partly: bear market | 0 of 7 |
Sources: Binance BTCUSDT spot and perpetual data (price, 200-day average, funding), DefiLlama (stablecoin supply), alternative.me (Fear & Greed), CoinGecko Research (2022 drawdown).
What the example shows: 2022 was a textbook winter, with every sign on at once. The 2025–26 decline was deep enough to hurt and long enough to count as a bear market, and sentiment was as bad as in 2022. What kept it out of winter is that the money stayed in the system: stablecoin supply dipped but stayed far above the year before, price never fell to the average cost of all coins, and no major lender or exchange failed. Today none of the seven signs is on. That doesn't predict the next move; it only says the conditions of a winter are absent right now.
For context, Bitcoin dominance was 59.2% of a $2.82 trillion crypto market on 13 October 2026 (CoinGecko).
What should you do in a crypto winter?
Nothing in this section is advice; it is what has tended to protect people when winters arrived.
- Decide your plan before the winter, not during it. Write down what you would sell, hold or buy at given drawdowns. The rules on our signals page are one example of setting the exit before the entry.
- Cut leverage first. Winters punish borrowed money. Much of the forced selling in 2022 came from leveraged funds and lenders such as Three Arrows Capital and Celsius.
- Know where your coins are. Winters expose weak custodians. Customers of Mt. Gox in 2014 and of FTX and Celsius in 2022 had their funds frozen in bankruptcy. Self-custody or a well-capitalised, regulated custodian reduces that risk.
- Watch liquidity, not headlines. Stablecoin supply and the 200-day average told you more in 2022–23 than any news story.
- Expect altcoins to suffer most. In past winters many altcoins fell 90% or more and never recovered. A high altcoin season index is a late-cycle reading; in a winter the index usually sits near the bottom of its range.
Where the winter phase sits in the wider cycle, and which signals came before past peaks, is covered in our guide to the bitcoin halving cycle. The best-known of those peak signals, the Pi Cycle Top indicator, stayed silent before the 2025–26 fall.
FAQ
What is a crypto winter?
A crypto winter is a long, deep bear market in cryptocurrencies, usually lasting most of a year or more. Bitcoin falls far below its all-time high and stays below its long-term trend, stablecoin money leaves the market, leverage collapses, companies fail or cut staff, and public interest fades.
How long does a crypto winter last?
Past winters kept Bitcoin below its 200-day average for 321 days in 2014–15, 385 days in 2018 and 381 days in 2022, on CoinGecko's method. Each took about a year from peak to bottom, and getting back to the old high took two to three years or more from the peak.
Is crypto in a winter right now?
Not as of 13 October 2026 by our seven-sign test. Bitcoin was about 34% below its high, had closed above its 200-day average since 19 August 2026, stablecoin supply was higher than a year earlier, and the Fear & Greed index read 57, "Greed". The 2025–26 decline was a bear market that came close to a winter but never ticked most of the signs.
What was the crypto winter of 2022?
It was the bear market that followed Bitcoin's November 2021 peak. Bitcoin fell 76.7% on closing prices to $15,742 in November 2022 (CoinGecko), while Terra/LUNA, Celsius, Three Arrows Capital and FTX collapsed. Total stablecoin supply shrank by about a third between April 2022 and August 2023 (DefiLlama).
What ends a crypto winter?
The forced selling running out, followed by money flowing back in. In past winters a capitulation event was followed by a long base; then stablecoin supply started growing, Bitcoin reclaimed its 200-day average and a new source of demand appeared, such as a halving or spot ETFs.
Figures as of 13 October 2026 from CoinGecko, CoinGecko Research, DefiLlama, alternative.me, LookIntoBitcoin and Binance market data. Methodology: how DanioX reads market seasons. Educational content, not financial advice.