USDT Dominance Explained: What USDT.D Says About Risk
USDT dominance is Tether's share of the crypto market. Learn how USDT.D is calculated, why it moves against Bitcoin and how to read it with BTC price.
· 9 min read
USDT dominance is Tether's share of the total crypto market cap: USDT's market cap divided by the value of every coin combined. Because USDT is where traders park money when they sell, a rising USDT dominance usually means risk appetite is falling, and a falling one means money is moving back into coins. As of 7 October 2026, USDT dominance was 6.49% of a $2.83 trillion market (CoinGecko). This guide explains how USDT.D is calculated, why it often moves opposite to Bitcoin, and the one check that stops most people misreading it.
Key takeaways
- USDT.D = USDT market cap ÷ total crypto market cap × 100. On TradingView it is the symbol
CRYPTOCAP:USDT.D. - It can rise for two different reasons: more USDT is minted (new money arriving), or everything else falls (selling). Those mean opposite things.
- A rising USDT.D while Bitcoin falls is the classic risk-off picture. A falling USDT.D while Bitcoin rises is risk-on.
- Always split a move into "supply" and "the rest of the market" before drawing a conclusion. The method is below.
- USDT.D is a mood gauge, not a timing signal. Read it alongside bitcoin dominance and Bitcoin's own trend.
What is USDT dominance?
USDT dominance (USDT.D) is the percentage of the total cryptocurrency market capitalisation held in Tether's USDT, the largest stablecoin. It answers a simple question: of all the money sitting in crypto, how much is sitting in dollars rather than in coins that move?
USDT.D = USDT market cap ÷ total crypto market cap × 100
USDT is designed to stay at $1, so its market cap is roughly its circulating supply. The figures on 7 October 2026:
| Measure | Value (2026-10-07) | Source |
|---|---|---|
| Total crypto market cap | $2.83 trillion | CoinGecko global data |
| USDT share of the total (USDT.D) | 6.49% | CoinGecko |
| USDC share of the total | 2.61% | CoinGecko |
| Bitcoin share of the total (BTC.D) | 59.30% | CoinGecko |
| USDT circulating supply | $184.2 billion | DefiLlama stablecoins |
| All USD stablecoins combined | $314.8 billion (about 11.1% of the total) | DefiLlama, divided by CoinGecko's total |
Tether publishes its own supply and reserve reports on its transparency page. Small differences between data providers are normal; they count supply on different chains at slightly different times.
USDT dominance vs stablecoin dominance
Stablecoin dominance is the broader version: the share of the market held in all dollar stablecoins (USDT, USDC, USDS, USDe and others), not just Tether. USDT is the largest of them, at $184.2 billion of the $314.8 billion total on 7 October 2026 (DefiLlama), so the two charts usually move together.
| USDT dominance | Stablecoin dominance | |
|---|---|---|
| What it counts | Tether only | All USD stablecoins |
| Where to see it | TradingView CRYPTOCAP:USDT.D, CoinGecko |
TradingView CRYPTOCAP:USDT.D + USDC.D, DefiLlama + a total-cap source |
| Strength | One liquid ticker, long history, what most traders watch | Not skewed by money moving between stablecoins |
| Weakness | Can move when money shifts from USDT to USDC (or back) | Fewer ready-made charts |
If USDT.D jumps but USDC's share falls by a similar amount, nothing has changed about risk appetite. Money has just switched stablecoin. That is why it is worth glancing at USDC.D too.
Why does USDT dominance move opposite to Bitcoin?
USDT.D tends to rise when Bitcoin falls because USDT is the default exit. Most spot crypto trades are priced against USDT, so when traders sell BTC or altcoins they usually end up holding USDT. The coins they sold lose value; the USDT they hold doesn't. Its share of the total goes up.
The reverse happens in a rally. Traders spend USDT on coins, and the coins they bought gain value, so USDT's share shrinks even if not a single USDT is redeemed.
This is the same denominator effect described in our guide to bitcoin dominance: stablecoins are part of the total market cap, so when they gain share, every coin's share has to fall, Bitcoin's included.
The four states of USDT dominance
Read USDT.D only alongside Bitcoin's price. The direction of each tells you very little on its own; the combination tells you a lot.
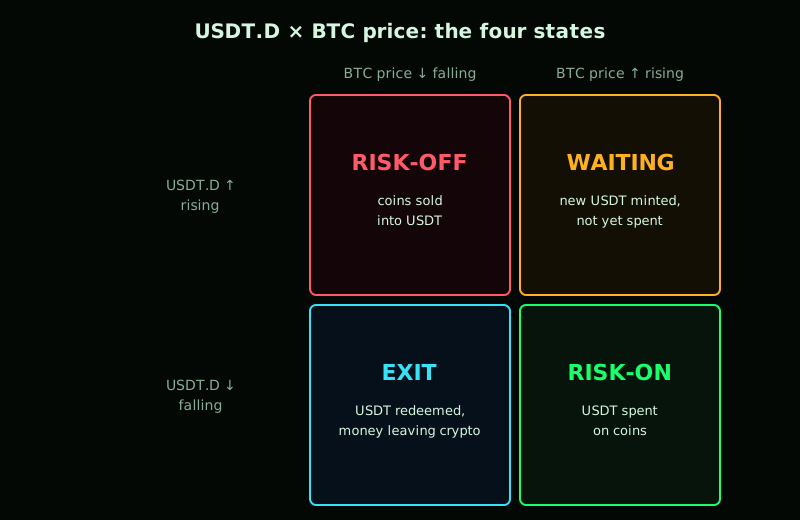
| USDT.D | BTC price | What it usually means |
|---|---|---|
| Rising | Falling | Risk-off. Traders are selling coins into USDT. The most common and clearest reading. |
| Falling | Rising | Risk-on. USDT is being spent on coins. Healthy rallies tend to look like this. |
| Rising | Rising | New money arriving but waiting. USDT supply is growing faster than prices. Often dry powder that has not been deployed yet. |
| Falling | Falling | Money leaving crypto. USDT is being redeemed for dollars while coins fall. Less common, and worth taking seriously. |
The first two rows are what most people mean when they say USDT dominance is "inverse" to Bitcoin. The last two are the reason that shortcut fails. When the last row lasts for months, with stablecoin supply shrinking while prices fall, it is one of the signs of a crypto winter.
How to read a USDT dominance chart: split the move
Every change in USDT.D comes from two sources, and you can separate them in a minute with free data:
- Supply: did the amount of USDT go up or down? (DefiLlama or Tether's transparency page.)
- The rest of the market: did the total crypto market cap go up or down? (CoinGecko or TradingView
TOTAL.)
Because USDT.D is a ratio, the percentage change in USDT.D is roughly the percentage change in supply minus the percentage change in the total market cap. That lets you say why it moved.
Worked example with today's numbers
Start from 7 October 2026: USDT supply $184.2 billion, total market $2.83 trillion, USDT.D 6.49%.
| Scenario | USDT supply | Total market cap | USDT.D | What drove it |
|---|---|---|---|---|
| Today | $184.2bn | $2.83tn | 6.49% | — |
| Market falls 10%, no new USDT | $184.2bn | about $2.55tn | about 7.2% | Selling. Risk-off. |
| $10bn new USDT minted, prices flat | $194.2bn | about $2.84tn | about 6.8% | New money arriving, not yet spent |
| Market rises 10%, no new USDT | $184.2bn | about $3.11tn | about 5.9% | Buying. Risk-on. |
The first two rows both show USDT.D rising by a similar amount, but one is a sell-off and the other is fresh capital waiting to be used. On a USDT.D chart alone they look the same.
What the split says right now: USDT supply was $183.4 billion on 9 July 2026 and $184.2 billion on 7 October 2026 (DefiLlama), almost unchanged. So over the past three months, moves in USDT.D have come almost entirely from the rest of the market, not from Tether minting or redeeming. Over twelve months supply grew about 4%, from $177.4 billion on 7 October 2025.
A five-step check
- Open USDT.D on the daily chart, not intraday.
- Note whether it is breaking out of a range or just wobbling inside one.
- Check Bitcoin's direction over the same period.
- Check USDT supply over the same period (the split above).
- Glance at USDC.D to rule out a switch between stablecoins.
Only then decide which of the four states you are in.
Is rising USDT dominance bearish?
Usually, yes, for coin prices, when it rises because the rest of the market is falling. That is a straightforward picture of selling into stablecoins. It is not automatically bearish when it rises because USDT supply is growing. New USDT is often minted when money is coming into crypto, and that money can be spent on coins later.
A few practical points:
- Breakouts matter more than single candles. A multi-week range breaking upward is a stronger risk-off sign than a one-day spike.
- Weekends and thin hours exaggerate moves. The denominator swings with altcoin prices, which can move sharply on low volume.
- Long-term levels drift. Stablecoins have grown as a share of crypto over the years, so comparing today's USDT.D level with one from years ago says more about that growth than about sentiment. Compare over months.
How USDT.D fits with bitcoin dominance and alt season
USDT.D answers "are people in or out of coins?". Bitcoin dominance answers "of the coins, is Bitcoin winning?". The two together separate rotation from retreat:
| BTC.D | USDT.D | Reading |
|---|---|---|
| Falling | Falling | Money moving into altcoins. Alt-season conditions, if Bitcoin is holding. |
| Falling | Rising | Coins are being sold into stablecoins. Not rotation; a sell-off where Bitcoin's share is being diluted by stablecoins. |
| Rising | Falling | Money moving into Bitcoin first. Bitcoin season. |
| Rising | Rising | Risk-off. Altcoins usually hit hardest. |
That second row is the trap the when is altcoin season checklist warns about: falling Bitcoin dominance that looks like alt season but is really a flight to stablecoins. For confirmation, DanioX also checks breadth and the altcoin season index, and the macro backdrop, such as a strong dollar index. Where these phases sit in the bigger picture is covered in the bitcoin 4-year cycle.
Common mistakes
- Treating every rise in USDT.D as bearish without checking whether supply grew.
- Ignoring USDC and other stablecoins, and mistaking a stablecoin switch for a change in mood.
- Trading intraday USDT.D wiggles, which mostly reflect altcoin volatility.
- Comparing levels across years when the stablecoin market itself has grown.
- Using it as an entry signal. It describes the mood; setups need their own rules, like the ones on our signals page.
FAQ
What does USDT dominance mean?
USDT dominance is the share of the total crypto market cap held in Tether's USDT. On 7 October 2026 it was 6.49% of a $2.83 trillion market (CoinGecko). A higher share means more of the money in crypto is parked in dollars rather than in coins.
Is USDT dominance going up good or bad?
For coin prices it is usually bad when it rises because the rest of the market is falling, which means traders are selling into USDT. It is not necessarily bad when it rises because more USDT is being minted, since that is often new money waiting to buy.
What is the difference between USDT.D and stablecoin dominance?
USDT.D counts Tether only. Stablecoin dominance counts all dollar stablecoins, including USDC, USDS and USDe. USDT is the largest, about $184 billion of roughly $315 billion on 7 October 2026 (DefiLlama), so the two usually move together.
Why does USDT dominance move opposite to Bitcoin?
Most crypto trading is priced against USDT, so selling BTC or altcoins usually leaves traders holding USDT. Coins lose value while USDT stays at $1, so its share rises. In rallies the opposite happens. The relationship breaks when USDT supply itself changes quickly.
Where can I see the USDT dominance chart?
TradingView lists it as CRYPTOCAP:USDT.D, and CoinGecko's global page shows the current share. For supply history, use DefiLlama's stablecoin dashboard or Tether's transparency page. Our bitcoin dominance page shows the related BTC.D reading live.
Figures as of 7 October 2026 from CoinGecko and DefiLlama. Educational content, not financial advice.