Pi Cycle Top Indicator: How It Works and Where It Failed
The Pi Cycle Top indicator compares Bitcoin's 111-day average with twice its 350-day average. Every signal since 2013, why it missed 2025, and today's gap.
· 11 min read
The Pi Cycle Top indicator is a Bitcoin chart signal that flags a possible cycle peak when the 111-day moving average crosses above twice the 350-day moving average. Analyst Philip Swift published it in April 2019 (LookIntoBitcoin). On our own recalculation it crossed four times, in April 2013, December 2013, December 2017 and April 2021, each within three days of a high. It then stayed silent through the whole 2024–25 cycle, including the record close of $124,659 on 6 October 2025, after which Bitcoin fell 53%. As of the 19 October 2026 daily close the fast line sat at just 48% of the doubled line. This guide shows how the indicator is built, every signal it gave, and why it went quiet.
Key takeaways
- The signal is a single event: the 111-day simple moving average (111DMA) closes above 2 × the 350-day simple moving average.
- It fired four times between 2013 and 2021. Three of those came before it was published, so only one was a true live test, and that one (April 2021) was seven months early for the cycle's final high.
- At the 2024 and 2025 highs the fast line never got close: at best it reached 74% of the doubled line (1 June 2024).
- It measures one thing, how far price has stretched above its yearly trend. Treat a crossover as a reason to check other signals, and its silence as no signal at all.
What is the Pi Cycle Top indicator?
The Pi Cycle Top indicator is a pair of moving averages drawn on Bitcoin's daily price. When the faster average climbs above the doubled slower one, price has run far ahead of its long-term trend, and in the cycles up to 2021 that happened within days of a major high.
| Line | Calculation | What it represents |
|---|---|---|
| Fast line | 111-day simple moving average of the daily close | Roughly the last four months of price |
| Slow line | 350-day simple moving average, multiplied by 2 | Twice the trend of the last year |
Why double the slow line? Without the ×2, the 111-day average would cross the 350-day average in every ordinary uptrend. Doubling it means the fast line only reaches it when the last four months have averaged more than twice the yearly average. That is a rare, near-vertical move.
Why "pi"? Because 350 divided by 111 is about 3.153, close to pi (3.14159). The name is a memorable label, not a reason the tool works. The window lengths were picked because they matched past tops.
How do you read a Pi Cycle Top signal?
You read it as one event: the first daily close on which the 111DMA is above the doubled 350DMA. Nothing else on the chart counts as a signal.
- Plot Bitcoin's daily close on a log-scale chart.
- Add the 111-day simple moving average.
- Add the 350-day simple moving average and multiply its values by 2.
- Mark the day the 111DMA crosses above the doubled line. That is the top signal.
- When the lines do not cross, measure the gap. "The fast line is at 57% of the doubled line" tells you far more than "no signal".
You do not need to calculate it yourself. Free charts at LookIntoBitcoin (now part of Bitcoin Magazine Pro), Blockchain.com and an open-source TradingView script draw it. Data providers use slightly different daily closes, so a crossover can move by a day or two between charts.
Every Pi Cycle Top crossover since 2013
The 111DMA crossed above the doubled 350DMA four times, and each crossover came within three days of a price high. Three of those highs were followed by drawdowns of more than 70%. We recalculated every date from daily prices rather than copying them from a chart.
| Crossover | Nearest high close | Days apart | Was it the cycle's final high? | What followed |
|---|---|---|---|---|
| 6 Apr 2013 | $230.68 on 9 Apr 2013 | 3 | No | Fell 71% to $66.34 by 6 Jul 2013, then a new high in December |
| 5 Dec 2013 | $1,134.93 on 4 Dec 2013 | 1 | Yes | Fell 85% to $175.64 by 14 Jan 2015 |
| 16 Dec 2017 | $19,640.51 on 16 Dec 2017 | 0 | Yes | Fell 84% to $3,185.07 by 15 Dec 2018 |
| 12 Apr 2021 | $63,575 on 13 Apr 2021 | 1 | No | Fell 53% to $29,790 by 20 Jul 2021, then a higher high of $67,526 on 8 Nov 2021 |
Daily closes: Coin Metrics reference rate for 2013–2017, Binance BTC/USDT for 2021. Both sources give the same 12 April 2021 crossover date.
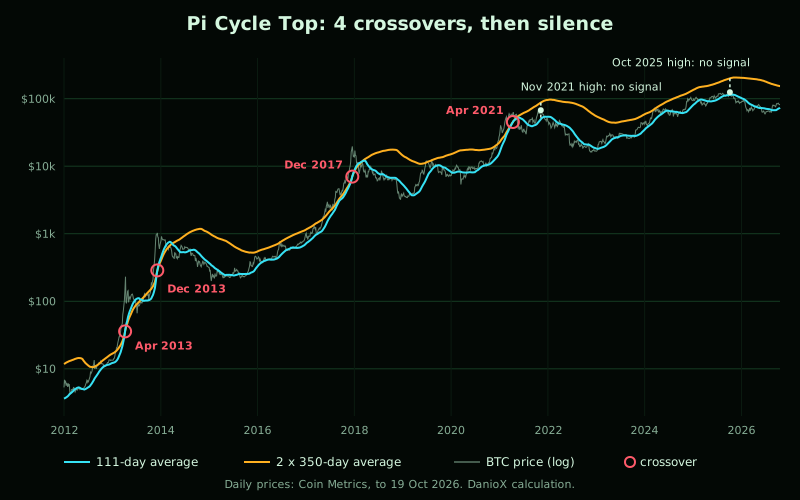
Two things stand out. The timing claim holds: every crossover sat within three days of a high, as Swift described. But only two of the four marked the final high of a cycle. In 2013 and 2021 the crossover came at a spring high, and the cycle peak came months later.
Where did the Pi Cycle Top indicator fail?
It failed twice: it was seven months early for the November 2021 high, and it never fired at all in the 2024–25 cycle. The second failure is the bigger one, because the lines were never even close.
November 2021: early in time, close in price. The April 2021 crossover was 210 days before the cycle's highest close. Measured in price, though, it was not a costly miss: the November close of $67,526 was only 6% above the April close of $63,575, and the April signal was followed by a 53% fall. Anyone who sold in April missed little upside. Anyone who waited for a second crossover never got one.
2024 and 2025: no signal at all. Here is how far below the doubled line the fast line was at each major high since 2021, on Binance daily closes:
| High close | Price | 111DMA | 2 × 350DMA | Fast line as % of doubled line |
|---|---|---|---|---|
| 13 Apr 2021 (signal) | $63,575 | $45,501 | $45,444 | 100% |
| 8 Nov 2021 | $67,526 | $49,532 | $87,222 | 57% |
| 13 Mar 2024 | $73,072 | $47,147 | $69,603 | 68% |
| 17 Dec 2024 | $106,134 | $74,933 | $129,755 | 58% |
| 6 Oct 2025 (record close) | $124,659 | $113,806 | $199,882 | 57% |
The closest the fast line came after 2021 was 74% of the doubled line, on 1 June 2024. After the October 2025 record, Bitcoin fell 53% to a $58,625 close on 30 June 2026. Someone waiting for the Pi Cycle to tell them when to sell would have held through the whole fall. Our guide to recognising a crypto winter scores that 2026 low against six other signs.
Why did the Pi Cycle Top stop working?
Because the tops changed shape, and because it was only ever tested on a handful of events. Both reasons point the same way: do not rely on it alone.
- It needs a parabolic top. A crossover requires the last four months of price to average more than twice the last year. In 2013 and 2017 price multiplied several times within months, so that was easy. The 2024–25 rally was slower and steadier, carried by spot ETFs and corporate buyers, and it never stretched that far above trend. LookIntoBitcoin's own chart page now notes that the indicator may stop being relevant after the launch of Bitcoin ETFs.
- Three of four signals were in-sample. Swift published the indicator in April 2019, after the 2013 and 2017 tops it was designed around. The April 2021 crossover was its only live signal, and it marked a spring high rather than the cycle peak. The 2025 top was its second live test, and it stayed silent.
- Four events cannot prove a rule. Any pair of averages fitted to a few past peaks will look accurate in hindsight. That is the same problem we describe in the Bitcoin 4-year cycle guide: there are too few cycles to be sure of any pattern.
What a crossover tells you is that price is extremely stretched above its trend. What it cannot tell you is whether a top will come with a crossover at all.
What does the Pi Cycle Top indicator say now?
As of the 19 October 2026 daily close (Binance), there is no signal and no sign of one: the fast line is at 48% of the doubled line.
| Reading (19 Oct 2026) | Value |
|---|---|
| Bitcoin close | $81,938 |
| 111-day average | $73,280 |
| 350-day average | $76,759 |
| 2 × 350-day average | $153,518 |
| Fast line as % of doubled line | 48% |
The 111-day average would have to more than double to reach the doubled line. Note that this low reading is not a buy signal. The indicator was built only to flag tops, and a wide gap simply means price is not stretched above its trend. For a reading that takes in dominance, the dollar and market breadth together, see the live market season on our signals page.
How does the Pi Cycle Top compare with other cycle-top tools?
The Pi Cycle Top is a price-only gauge, so it is most useful next to tools that measure something else: holder profits, leverage, sentiment and breadth.
| Tool | What it measures | Typical warning at a top | Main weakness |
|---|---|---|---|
| Pi Cycle Top | Price stretch vs the yearly trend | 111DMA crosses 2 × 350DMA | Needs a parabolic top; silent in 2025 |
| MVRV and NUPL | Unrealised profit across all holders | Very high readings | Thresholds drift lower as the market matures |
| Funding rates and open interest | Leverage crowding | Persistently high funding | Can stay high for weeks |
| Fear & Greed Index | Sentiment | Extreme greed | Stays greedy through strong trends |
| Altcoin season index | Breadth and late-cycle speculation | Very high reading | Confirms a late cycle, does not time it |
A crossover alongside crowded leverage and extreme greed is a very different picture from a crossover on its own. Our methodology page explains how DanioX combines several of these inputs into one market season label, and when is altcoin season covers the breadth side.
How can you use the Pi Cycle Top indicator sensibly?
Use it as a prompt to review risk, not as an order to sell, and never as permission to hold.
- Treat a crossover as a "check the others" trigger. Look at valuation, leverage, sentiment and the dollar before acting.
- Do not wait for it. In 2025 it never fired. If other signals are flashing, its silence means nothing.
- Watch the gap, not just the cross. A fast line climbing from 50% towards 90% of the doubled line says more than a yes/no reading.
- Sell in stages. Reducing risk in parts as several signals line up is more forgiving than betting on one day.
- Prefer rules you can test. A rule with four data points cannot be checked. If you want a moving-average rule with a published backtest, our regime trend signals use Bitcoin's 200-day average as an on/off switch and publish the backtest year by year.
Data and method
We downloaded Bitcoin's daily prices and computed both averages ourselves. Daily reference prices from Coin Metrics community data cover July 2010 to 19 October 2026. Binance BTC/USDT daily closes cover August 2017 onwards and were used for every figure from 2021, where they give the same crossover date as Coin Metrics. The 111DMA and 350DMA are simple averages of daily closes. A crossover is the first close with the 111DMA above twice the 350DMA. The June 2011 bubble cannot be tested: the 350-day average only exists from July 2011, when the fast line was already above the doubled line. Creator, date and the "within three days" description come from LookIntoBitcoin's indicator page. Past behaviour does not guarantee future results.
FAQ
Did the Pi Cycle Top indicator call the 2021 top?
Partly. It crossed on 12 April 2021, one day before that spring's high close of $63,575, and Bitcoin then fell 53%. But the cycle's highest close came on 8 November 2021 at $67,526, about 6% higher, with no second crossover. It was right about the stretch and seven months early for the final high.
Has the Pi Cycle Top crossed in 2025 or 2026?
No. At the record close of $124,659 on 6 October 2025 the 111-day average was only 57% of twice the 350-day average. The closest approach since 2021 was 74% on 1 June 2024. On 19 October 2026 it was 48%, so no crossover is near.
Why is it called the Pi Cycle Top indicator?
Because 350 divided by 111 is about 3.153, close to the number pi (3.14159). The two windows were chosen because they lined up with the 2013 and 2017 peaks, and the pi link is a coincidence that made the name memorable. It does not explain why the indicator worked or stopped working.
What is the best top indicator for Bitcoin?
No single indicator has called every top. The Pi Cycle Top caught two final highs and missed the 2025 one entirely. Combining tools that measure different things, such as price stretch, holder profits, leverage, sentiment and breadth, and reducing risk in stages when several agree, has a better record than trusting any one.
Where can I see a live Pi Cycle Top chart?
LookIntoBitcoin (Bitcoin Magazine Pro) and Blockchain.com both publish free Pi Cycle Top charts, and TradingView has an open-source script you can add to any Bitcoin chart. Expect small differences of a day or two in crossover dates, because each uses a different daily price source.
Figures as of 19 October 2026 from Coin Metrics and Binance market data, calculated by DanioX; indicator history from LookIntoBitcoin. Methodology: how DanioX reads market seasons. Educational content, not financial advice.