NUPL and Realized Price: Reading Bitcoin Holder Profit
NUPL shows how much of Bitcoin's value is unrealized profit; realized price is holders' average cost. Formulas, zones, each cycle since 2013 and today's level.
· 12 min read
NUPL (Net Unrealized Profit/Loss) is a Bitcoin on-chain indicator that shows what share of Bitcoin's market value is paper profit or loss for its holders. It equals market cap minus realized cap, divided by market cap. Realized price is realized cap divided by the coin supply: the average price at which every Bitcoin last moved, roughly the whole market's cost basis. On 10 November 2026 NUPL was 0.27 and the realized price was $53,899, with Bitcoin at $73,661 (Coin Metrics daily data). Holders were in profit on average, about 27% of the market's value, in the band usually called optimism/anxiety.
Key takeaways
- NUPL = (market cap − realized cap) ÷ market cap. Below 0, holders as a group sit on a loss. Near 1, almost all of the market's value is unrealized profit.
- Realized price = realized cap ÷ supply. When Bitcoin trades below it, the average coin is worth less than it last moved at.
- Each cycle's NUPL peak has been lower: 0.83 in 2013, 0.79 in 2017, 0.747 in 2021 and 0.64 in March 2024. At the October 2025 price record it was only 0.56.
- The 2026 low did not reach the capitulation zone. On 30 June 2026 Bitcoin closed at $58,525, still 10% above a realized price of $53,070 (NUPL +0.09). The 2015, 2018 and 2022 lows all went below it.
- Both gauges describe holder profit. They don't forecast prices or say when a turn will come.
What is NUPL?
NUPL is the net share of Bitcoin's market value that holders have not yet realized as profit or loss. A NUPL of 0.5 means half of the market cap is unrealized profit.
It comes from three quantities:
| Term | Meaning | 10 Nov 2026 |
|---|---|---|
| Market cap | Every coin valued at today's price (price × supply) | $1,481bn |
| Realized cap | Every coin valued at the price when it last moved on-chain | $1,084bn |
| Unrealized profit/loss | Market cap − realized cap: what holders would book if every coin were sold at today's price | +$397bn |
NUPL = (market cap − realized cap) ÷ market cap = (1,481 − 1,084) ÷ 1,481 = 0.27
What a fall does (a scenario, not a forecast): keep the realized cap at $1,084bn and cut the market cap to $1,200bn, about 19% lower. NUPL drops to (1,200 − 1,084) ÷ 1,200 = 0.10. At a market cap of $1,000bn it is (1,000 − 1,084) ÷ 1,000 = −0.08, and holders as a group are at a loss. Realized cap moves too, but slowly, so in the short run NUPL follows price.
Tamas Blummer, Tuur Demeester and Michiel Lescrauwaet of Adamant Capital published the measure in February 2019 under the name Relative Unrealized Profit/Loss (LookIntoBitcoin). Both names mean the same thing.
What is Bitcoin's realized price?
Bitcoin's realized price is the realized cap divided by the number of coins. It is the average price at which every existing Bitcoin last moved on-chain, so it approximates what the market as a whole paid. On 10 November 2026 it was $53,899.
Realized cap came from Coin Metrics in 2018 and is credited to Nic Carter and Antoine Le Calvez (Glassnode metric guide). The idea: a coin's last on-chain move is the best public estimate of what its current holder paid. Coins that have not moved for years, including lost ones, are counted at their old, low prices, which pulls the average down.
| Measure | What it is | How it moves |
|---|---|---|
| Market price | The last traded price | Every second |
| Realized price | Average on-chain cost of all coins | Slowly, only when coins move |
Realized price is not fixed. It rises when coins bought cheaply are sold at higher prices and falls when coins bought high change hands lower. After the October 2025 record it peaked at $56,463 on 26 November 2025, slipped to $52,707 by 11 August 2026 as buyers from the top sold at a loss, and was back at $53,899 by 10 November 2026.
What do the NUPL zones mean?
The common chart splits NUPL into five bands named after holder mood. The band boundaries below are the ones on the LookIntoBitcoin NUPL chart.
| NUPL | Zone | What it says about holders |
|---|---|---|
| Below 0 | Capitulation | The average holder is at a loss |
| 0 to 0.25 | Hope / Fear | Small profit; a modest fall puts the market under water |
| 0.25 to 0.5 | Optimism / Anxiety | Comfortable profit; early bull market or a cooling one |
| 0.5 to 0.75 | Belief / Denial | Large profit; a mature bull market |
| Above 0.75 | Euphoria / Greed | Most of the market's value is paper profit |
Some charts swap the names of the two middle bands, so check the numbers rather than the labels. The bands are conventions on a continuous scale. A reading of 0.74 is not a different market from 0.76.
How has NUPL behaved in each Bitcoin cycle?
Each cycle's NUPL peak has been lower than the one before, and the 2026 bear market is the first since 2011 in which price stayed above realized price. We calculated NUPL from Coin Metrics daily data from July 2010 to 10 November 2026 (NUPL = 1 − 1 ÷ MVRV, since MVRV is market cap ÷ realized cap).
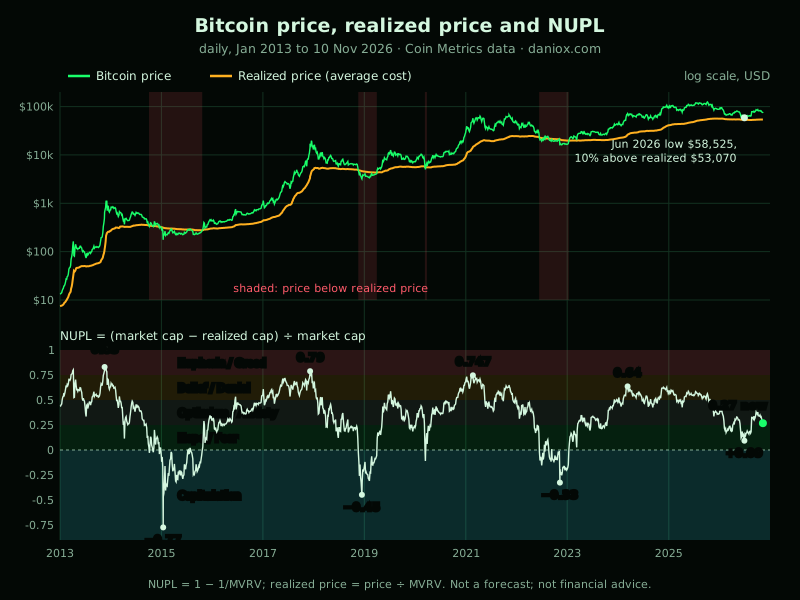
The peaks. Euphoria (0.75 and above) lasted 44 days in the 2013 cycle and 10 days in 2017. It never came in the 2021 or 2024–25 cycles on this data:
| Cycle | Highest NUPL | Date | NUPL at the price top | Price top |
|---|---|---|---|---|
| 2013 | 0.83 | 18 Nov 2013 | 0.79 | $1,135, 4 Dec 2013 |
| 2017 | 0.79 | 7 Dec 2017 | 0.77 | $19,641, 16 Dec 2017 |
| 2021 | 0.747 | 21 Feb 2021 | 0.65 | $67,542, 8 Nov 2021 |
| 2024–25 | 0.64 | 11 Mar 2024 | 0.56 | $124,824, 6 Oct 2025 |
Two things stand out. The highest reading has come down every cycle, and twice now (2021, 2024–25) NUPL peaked months before price did. A rule like "sell when NUPL reaches 0.75" would not have triggered at all in the last two cycles. A larger, older market has more coins bought at high prices and fewer coins held since the cheap years, so the share of value that is paper profit cannot climb as far.
The lows. Capitulation (NUPL below zero, price below realized price) came in every bear market until this one:
| Bear market | Days below realized price | Lowest NUPL | Price vs realized price that day | Further fall after the first day below |
|---|---|---|---|---|
| 2014–15 | 304 (Oct 2014 to Oct 2015) | −0.77, 14 Jan 2015 | $176 vs $312 | −47% |
| 2018–19 | 134 (19 Nov 2018 to 1 Apr 2019) | −0.45, 15 Dec 2018 | $3,185 vs $4,613 | −34% |
| March 2020 | 6 (12 to 18 Mar 2020) | −0.11, 16 Mar 2020 | $5,013 vs $5,566 | about 0% |
| 2022–23 | 179 (13 Jun 2022 to 12 Jan 2023) | −0.33, 9 Nov 2022 | $15,758 vs $20,901 | −29% |
| 2025–26 | 0 | +0.09, 30 Jun 2026 | $58,525 vs $53,070 | n/a |
Price first crossing below realized price was not the low. In three of the four episodes Bitcoin fell another 29% to 47% before the bottom. That matches what our tops and bottoms scorecard found for MVRV under 1. Whether June 2026 was the final low of this cycle is still open. Our crypto winter guide looks at the other bottom signals for that period, and the Bitcoin 4-year cycle guide puts the dates in the wider pattern.
Where are NUPL and realized price now?
On 10 November 2026 NUPL was 0.27, just above the 0.25 line between optimism and hope, and Bitcoin traded 37% above its realized price. The reading has been falling for a month.
| Measure | Reading | Date | Source |
|---|---|---|---|
| Bitcoin price | $73,661 | 10 Nov 2026 (daily) | Coin Metrics |
| Bitcoin price | $73,641 | 11 Nov 2026, 05:02 UTC | CoinGecko |
| Realized price | $53,899 | 10 Nov 2026 | Coin Metrics (price ÷ MVRV) |
| Price vs realized price | +36.7% | 10 Nov 2026 | Calculated |
| MVRV | 1.37 | 10 Nov 2026 | Coin Metrics |
| NUPL | 0.27, optimism / anxiety | 10 Nov 2026 | Calculated (1 − 1 ÷ MVRV) |
| NUPL a month earlier | 0.36 | 11 Oct 2026 | Calculated |
| Cross-check | NUPL 0.330, realized price $53,952 | 4 Nov 2026 | BGeometrics (Coin Metrics, same day: 0.329, $54,013) |
The path since the record:
- 6 Oct 2025: price top at $124,824, NUPL 0.56 (belief).
- 16 Oct 2025: NUPL falls under 0.5, ten days after the top.
- 4 Feb 2026: under 0.25, into hope / fear, for the first time since October 2023.
- 30 Jun 2026: cycle low so far, NUPL +0.09, price 10% above realized price.
- 20 Aug 2026: back above 0.25, and it has stayed above since.
- 10 Nov 2026: 0.27, down from 0.36 on 11 October as price fell from $83,637 to $73,661.
At today's realized price, NUPL would cross back under 0.25 near $71,900 (realized price ÷ 0.75) and reach zero at $53,899. These are arithmetic, not targets: the realized price will keep drifting as coins change hands.
How do NUPL, MVRV and the MVRV Z-score compare?
They all compare market value with realized value. NUPL and MVRV are the same information in different units (MVRV = 1 ÷ (1 − NUPL)); the Z-score scales the gap by the market cap's past volatility.
| Measure | Formula | 10 Nov 2026 | Strength | Weakness |
|---|---|---|---|---|
| NUPL | (market cap − realized cap) ÷ market cap | 0.27 | Bounded below 1, easy zones | Peaks drift lower each cycle |
| MVRV | Market cap ÷ realized cap | 1.37 | Simple ratio; 1 = break-even | No upper bound |
| Realized price | Realized cap ÷ supply | $53,899 | A price level you can put on a chart | Not normalised |
| MVRV Z-score | (market cap − realized cap) ÷ standard deviation of market cap | 0.64 (our calculation) | Adjusts for the market's size and swings | Peaks have shrunk even faster |
Our Z-score uses the standard deviation of all daily market caps up to each day. Its cycle peaks were 10.7 in April 2013, 10.1 in December 2017, 7.2 in February 2021 and 3.4 in December 2024. The often-quoted "top zone above 7" was not reached in the last cycle. Other providers use slightly different inputs, so their Z-score numbers differ from ours.
How do you use NUPL and realized price?
Use them to judge how much profit holders are sitting on and how far price is from their average cost, not to time trades.
- Read the zone and the direction together. Falling from 0.36 to 0.27 in a month (where we are now) is a different market from rising through the same level.
- Compare price with realized price. Near or below it, the average holder is at break-even or worse. In past cycles that came close to the lows, but not at the exact low.
- Don't wait for old thresholds. Peaks have come in lower every cycle, so a fixed 0.75 sell rule would have missed the last two.
- Add leverage and liquidity. A high NUPL with crowded funding is a stronger warning than either on its own. Our crypto trading signals guide explains how we combine inputs, and the Pi Cycle Top guide shows how a single top signal went quiet in 2025.
- Ignore small moves. A change of 0.02 in NUPL is a few percent on price and means little.
The signals page shows the current market label and the rules behind it, and the methodology page explains how we test signals.
Data and method
- Source: Coin Metrics community data, Bitcoin daily
PriceUSD,CapMrktCurUSD,SplyCurandCapMVRVCurfrom 18 July 2010 to 10 November 2026, downloaded 11 November 2026. - Calculations: NUPL = 1 − 1 ÷ MVRV; realized price = price ÷ MVRV; realized cap = market cap ÷ MVRV. Cycle peaks and lows are the highest and lowest daily values in each window. "Further fall" runs from the first daily close below realized price to the lowest close of that episode.
- Cross-checks: BGeometrics (4 November 2026) matched Coin Metrics within about 0.1% on realized price. The zone boundaries follow LookIntoBitcoin.
- Why providers differ: Glassnode, CryptoQuant, BGeometrics and Coin Metrics run their own nodes and treat details such as early coins differently, so their NUPL figures for the same day can differ by a few hundredths. Older peaks show the biggest gaps. Our 2021 peak of 0.747 sits just under the 0.75 line, while some charts show it just above.
- Not a forecast. Five cycles is a small sample, and every number here describes the past.
This is education, not financial advice.
FAQ
What is NUPL?
NUPL (Net Unrealized Profit/Loss) is a Bitcoin on-chain indicator that shows what share of the market's value is paper profit or loss for holders. It equals market cap minus realized cap, divided by market cap. On 10 November 2026 it was 0.27, in the optimism/anxiety zone.
What does a negative NUPL mean?
A negative NUPL means the market cap is below the realized cap, so holders as a group are at an unrealized loss and price is below the realized price. It happened in 2015, 2018–19, March 2020 and 2022–23, near those bear-market lows, but not in the 2026 fall.
What is Bitcoin's realized price?
Bitcoin's realized price is the average price at which every existing coin last moved on-chain: realized cap divided by supply. It approximates the whole market's cost basis. It was $53,899 on 10 November 2026, when the market price of $73,661 stood about 37% above it.
What is the difference between NUPL and MVRV?
Both compare market value with realized value. MVRV is market cap divided by realized cap; NUPL is the gap between them as a share of market cap. They carry the same information: MVRV = 1 ÷ (1 − NUPL). An MVRV of 1.37 equals a NUPL of 0.27.
What is NUPL in the Philippines?
In the Philippines, NUPL usually means the National Union of Peoples' Lawyers, a lawyers' group. It has nothing to do with the crypto indicator. In this guide NUPL means Net Unrealized Profit/Loss, an on-chain measure for Bitcoin.
Can NUPL predict a Bitcoin top?
Not on its own. NUPL reached 0.75 or higher near the 2013 and 2017 tops, but in 2021 and 2024–25 it peaked months before price and never reached that zone. It shows how much profit holders have. It does not say when they will sell.